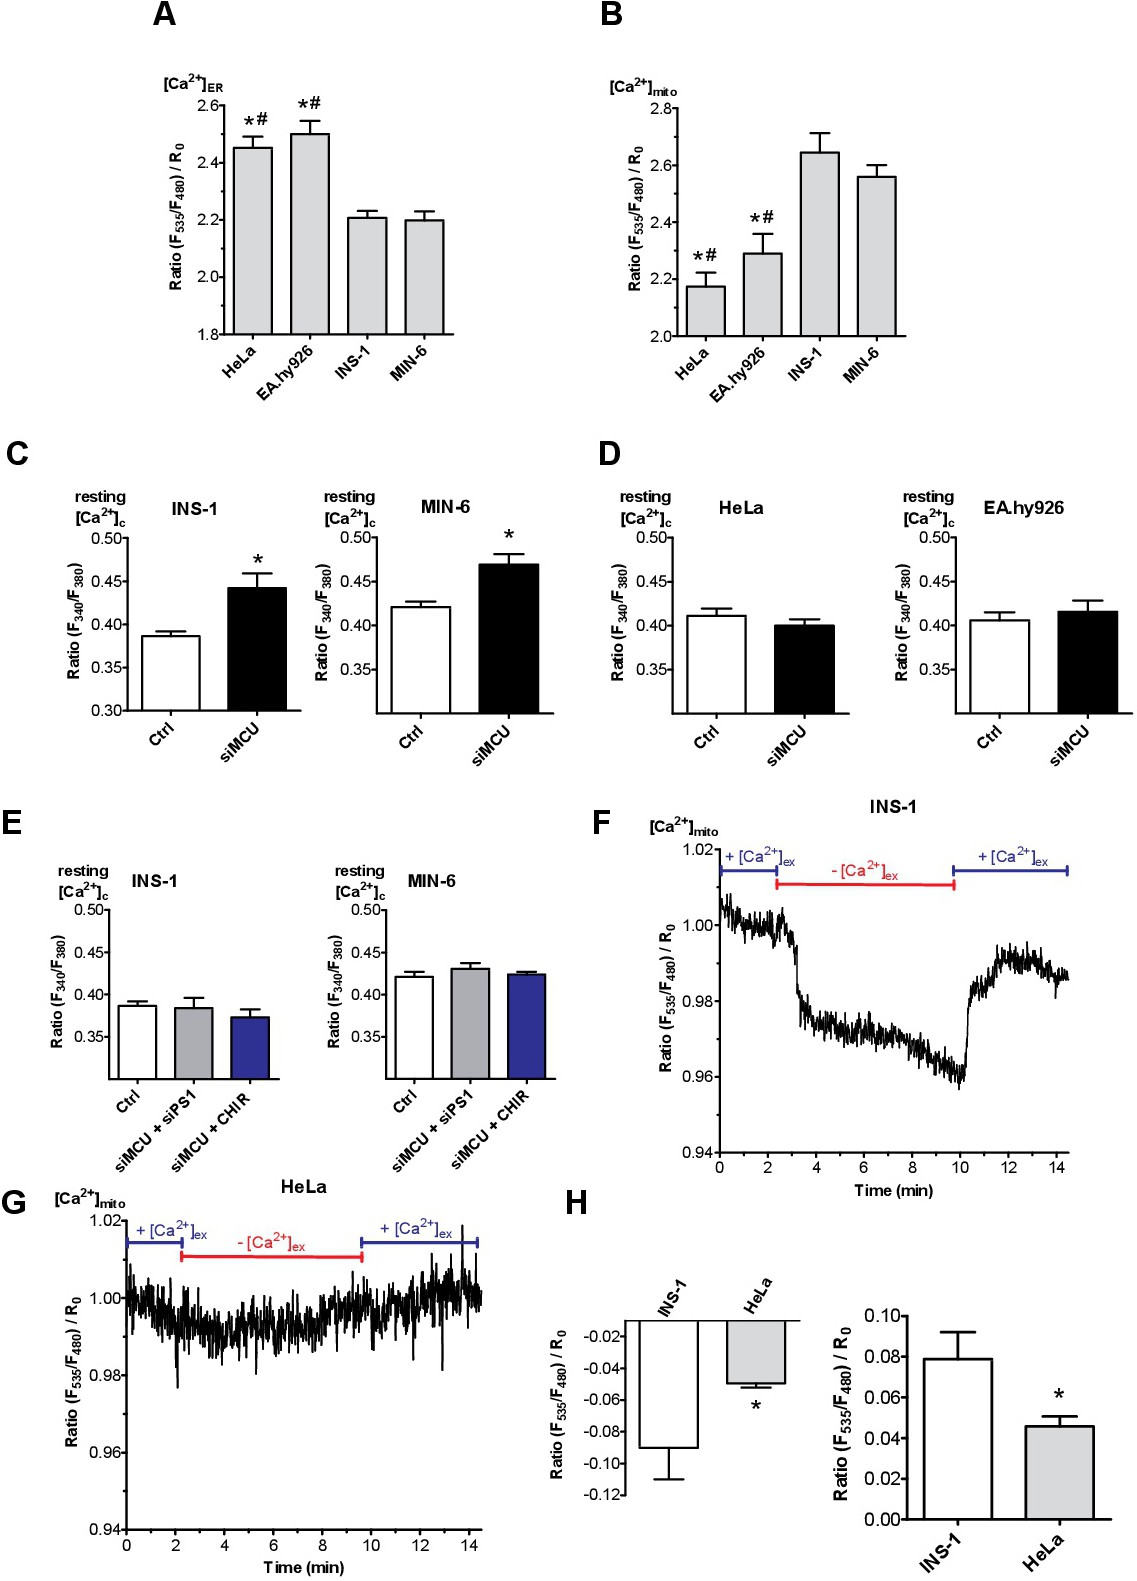
Fig. 7. Mitochondria serve as Ca2+ sink for ER leakage. (A,B) Bars represent basal ratios of [Ca2+]ER measured with D1ER (A) or [Ca2+]mito measured with 4mtD3cpv (B) in HeLa, EA.hy926, INS-1 and MIN-6 cells. Bar charts indicate mean ± SEM (n ≥ 6). *p<0.05 versus INS-1; #p<0.05 versus MIN-6 using one-way ANOVA. (C-F) Bars represent the basal ratio of [Ca2+]cyto measured with Fura-2/AM under Ca2+-free conditions in (C,E) INS-1 and MIN-6 cells as well as (D,F) in HeLa and EA.hy926 cells under control conditions (white bars) and siRNA against MCU (black bars) (C,D), as well as under control conditions (white bars), a combination of siRNA against MCU and PS1 (grey bars) and a combination of siRNA against MCU and treatment with CHIR99021 (2.5 µM; blue bars) (E) (n ≥ 6). *p<0.05 versus control using the unpaired Student's t-test and also with one way ANOVA where applicable. (F,G) Normalized [Ca2+]mito ratio signals measured over time in INS-1 (F) as well as in HeLa (G) in 2 mM Ca2+ (2Ca2+) containing or Ca2+-free-EGTA buffered solution as indicated in the graph. To visualize the max. mitochondrial Ca2+ uptake and proper functionality of the sensor cells were stimulated with 100 µM carbachol (Cch) for β-cells and 100 µM histamine (His) for non-β-cells together with 15 µM BHQ. (H) Statistics on the absolute drop in mitochondrial Ca2+ upon removal of extracellular Ca2+ (left panel) and the rise in mitochondrial Ca2+ after re-addition of extracellular Ca2+ (right panel). *p<0.05 versus β-cells using the unpaired Student's t-test (n ≥ 6).